After two years of Obama ---here's your change! (2011 version) or this one...(2012 version)?
The first thing to note....the only differences between 2011 and 2012 is the retail gas price. Not one other stat has been touched/updated.
So, just with average retail price per gallon....if one does not remember, in 2008 it hit an all time high.
Looking from the last term that Bush was in office until now, this is what that looks like:
 |
| src - gasbuddy.com/gb_retail_price_chart.aspx |
The bump in gas prices for 2008 was due to a bunch of reasons; from 2004 demand pressure, Katrina, Middle East shananagians, low supplies, and the worst - speculators. Hrmmm...Market price correction?
Let's take a look Crude Oil -
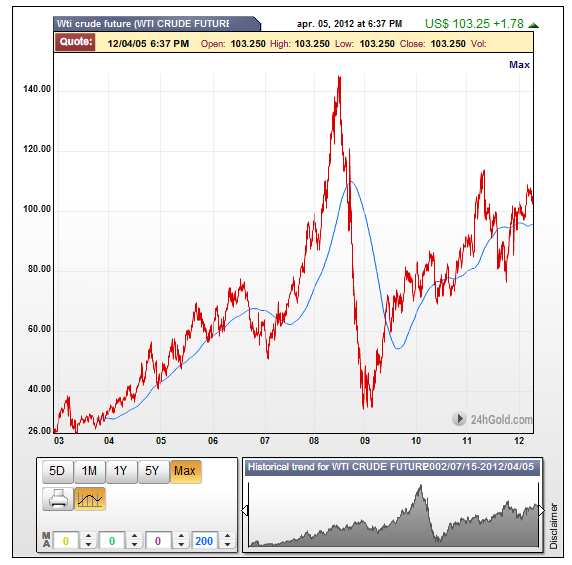 |
| this looks familiar - http://quotes.post1.org/historical-crude-oil-price-chart/ |
Corn Prices:
 |
| http://futures.tradingcharts.com/chart/CN/M |
Impacts from weather and natural disasters will ebb and flow over time and population growth will continue. But policy changes like ending ethanol subsidies, eliminating or moderating other crop subsidies, moderating regulation on herbicide use, eliminating food tariffs/taxes, allowing more water use for agriculture, etc. all could help lower food costs. Finally, actions to lower oil prices could help food inflation.One thing has changed....the ethanol subsides have ended (that had been in place for 60 years). And yet the price of corn is still very high.
Up next...Soybeans...
 |
| http://futures.tradingcharts.com/chart/SB/M |
 |
| http://www.indexmundi.com/commodities/ |
Unemployment:

Unemployement started rising while Bush was still in office, ending at 7.3% in Dec 2008. currently...it rests at 8.3% down from a high of 10% in October 2009.
Number of food stamp recipiants - From the U.S. Gov website....
Totals from 2002 to 2011 are:
| 2002 | 19,096 | 79.67 | 18,256.20 | 2,380.82 | 20,637.02 |
| 2003 | 21,250 | 83.94 | 21,404.28 | 2,412.01 | 23,816.28 |
| 2004 | 23,811 | 86.16 | 24,618.89 | 2,480.14 | 27,099.03 |
| 2005 | 25,628 | 92.89 | 28,567.88 | 2,504.25 | 31,072.13 |
| 2006 | 26,549 | 94.75 | 30,187.35 | 2,715.74 | 32,903.09 |
| 2007 | 26,316 | 96.18 | 30,373.27 | 2,817.26 | 33,190.54 |
| 2008 | 28,223 | 102.19 | 34,608.40 | 3,031.60 | 37,639.99 |
| 2009 | 33,490 | 125.31 | 50,359.92 | 3,275.30 | 53,635.22 |
| 2010 | 40,302 | 133.79 | 64,704.45 | 3,604.24 | 68,308.69 |
| 2011 | 44,709 | 133.85 | 71,812.23 | 3,862.15 | 75,674.39 |
National Debt:

So, did this start with Obama?